https://jamanetwork.com/journals/jamacardiology/fullarticle/2844579
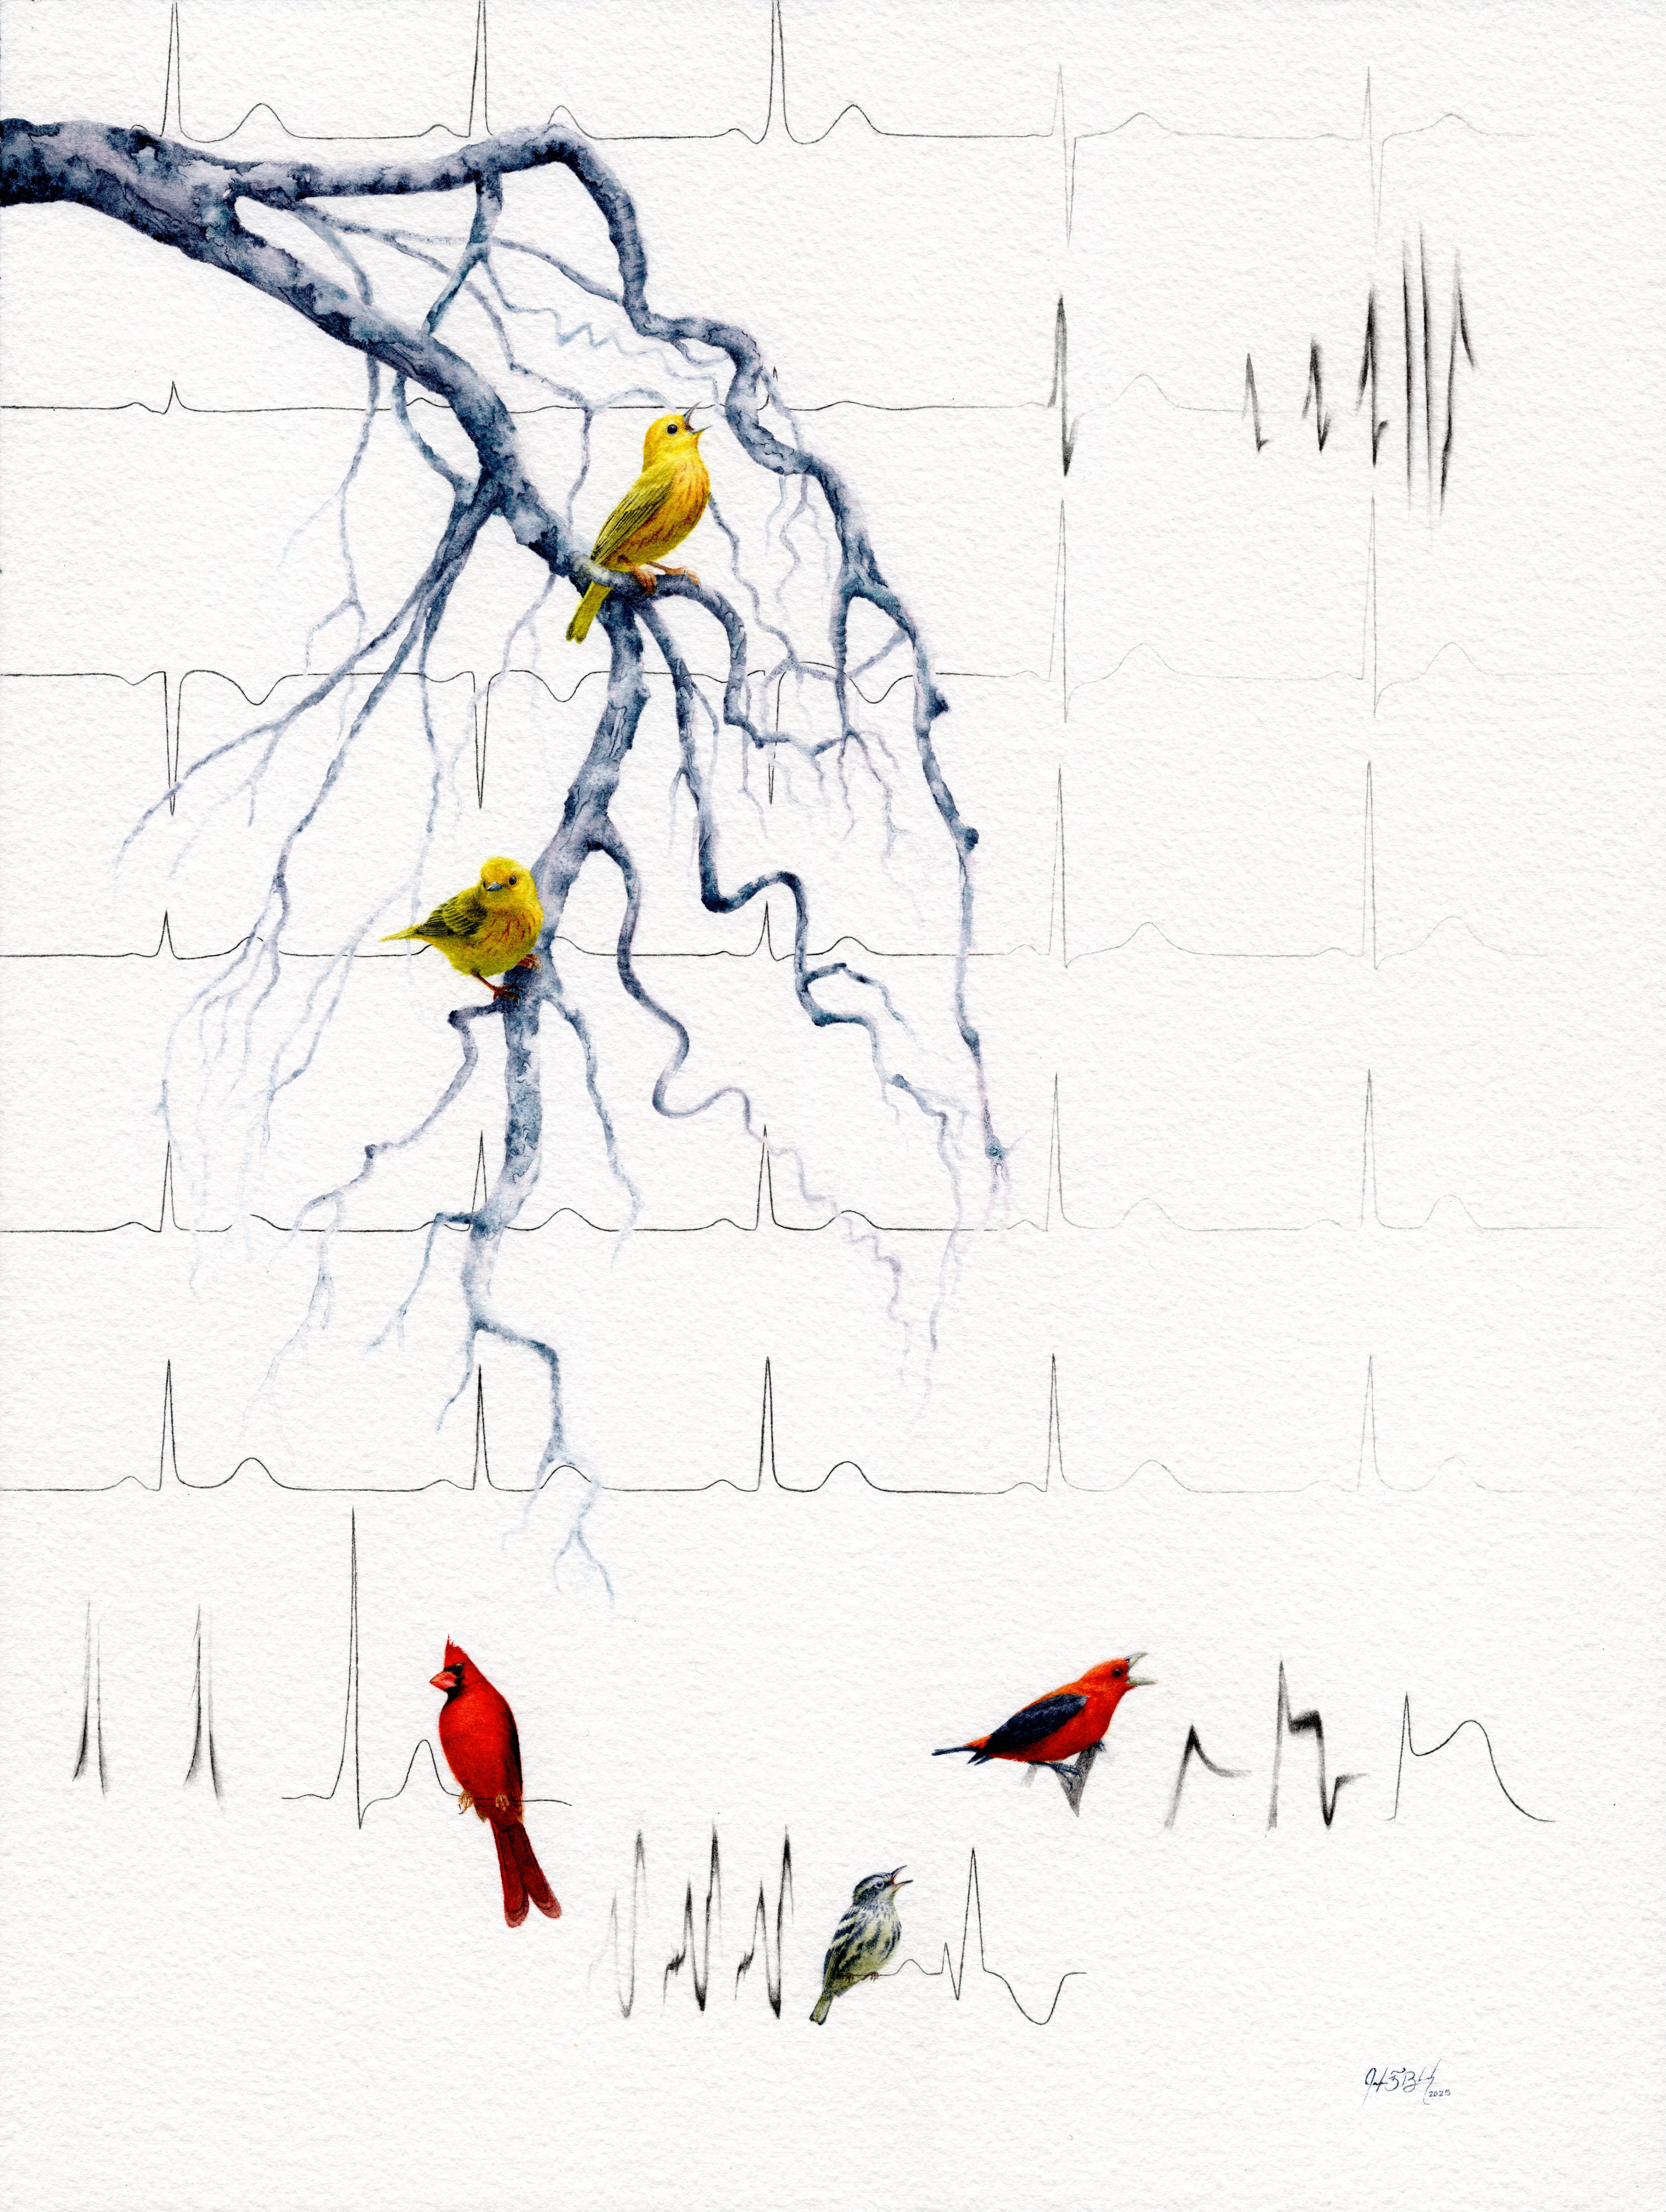
Watercolor, 2024
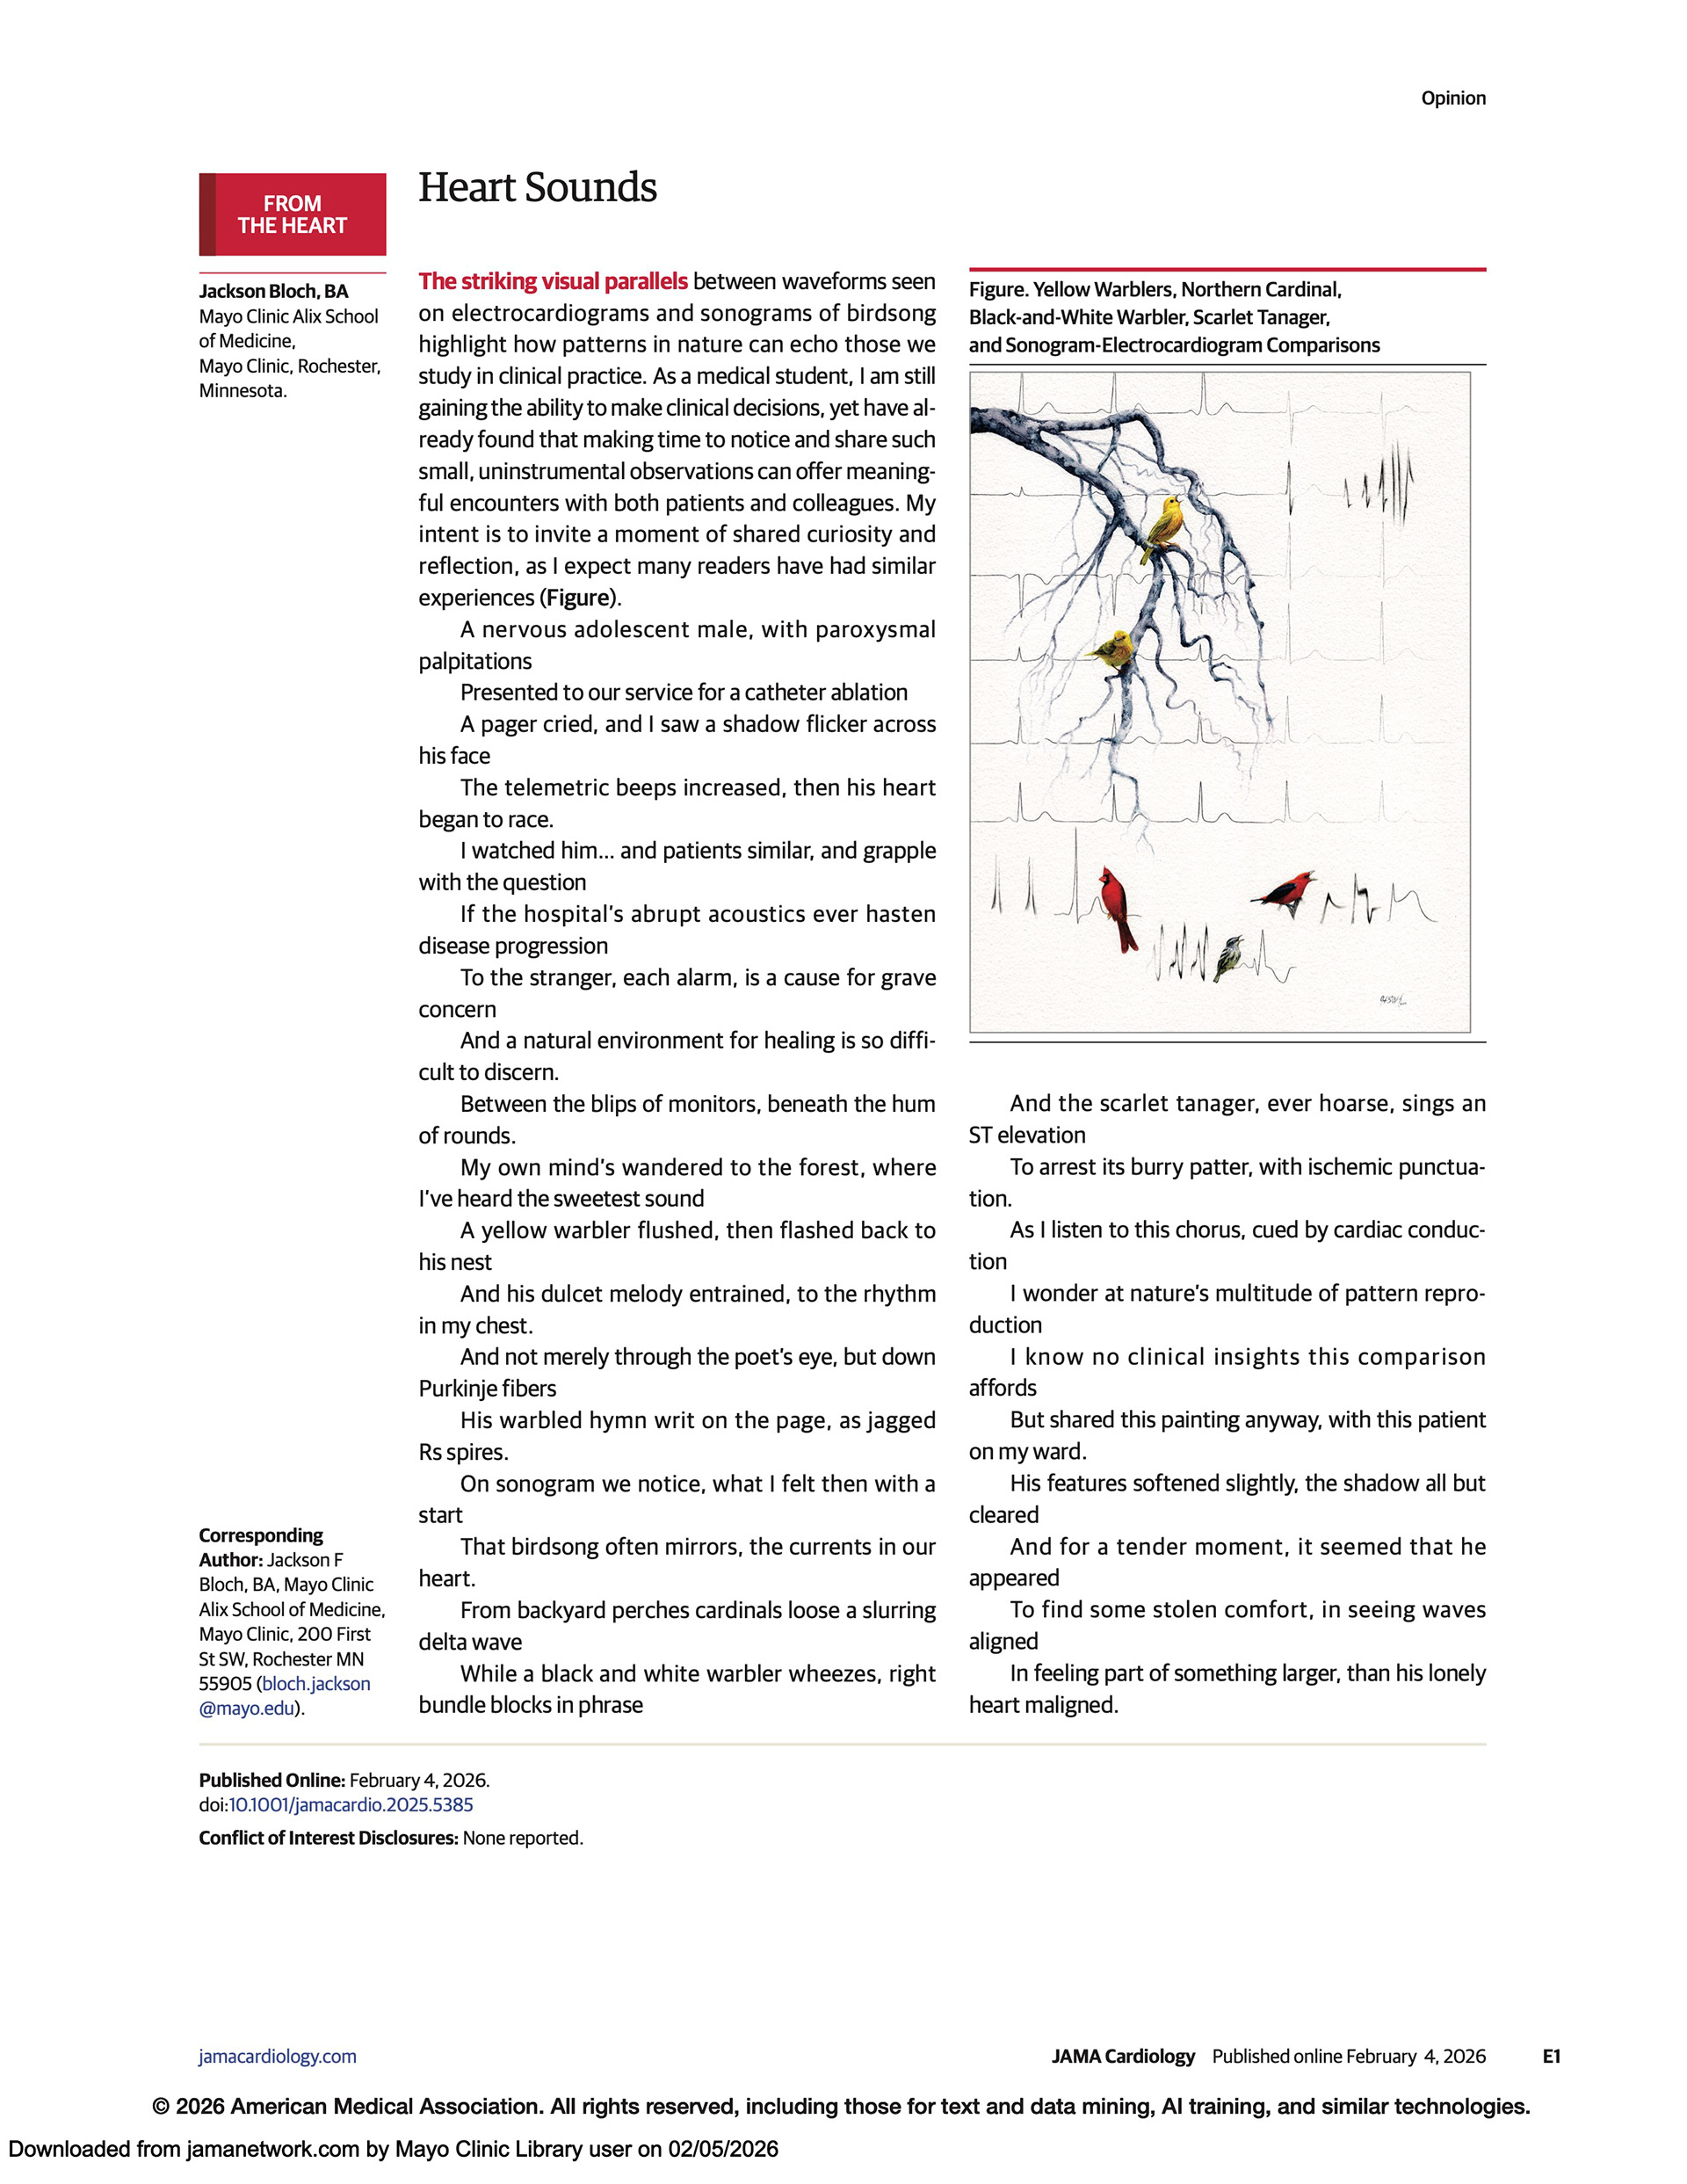
This painting compares elements of ECG waveforms to sonograms of birdsong, which are visual representations of the song’s acoustic qualities. The Yellow Warbler’s song, seen top right, maps on to the Rs complex of the V3 region of a normal ECG. In the bottom left, the slurring chirp of the Northern Cardinal looks similar to a delta wave in Wolff-Parkinson-White syndrome, while the wheezy song of the Black-and-white Warbler looks similar to a right-bundle branch block. Finally, the burry patter of a scarlet tanager has a component similar to an ST elevation. In addition, the branches upon which the Yellow Warblers sit describe the coronary arteries. The two Yellow Warblers sit on the Left Anterior Descending, which corresponds to the V3 lead of the ECG to which the songs is matched.